Why post-game analysis beats the scoreboard
The score records an outcome. It does not explain it. A proper breakdown explains the outcome — and turns it into something you can use before the next puck drop.
Separate result from performance
A team can win 2–1 while getting out-chanced 18–34, and dominate for 55 minutes only to lose on a late bounce. Analysis shows what was repeatable and what was luck.
Catch recurring patterns
Zone entries along the wall or through the middle, forecheck pressure, a power play that only works off one half-wall. Structure only becomes visible across a series of games.
See trends, not flashes
One big night is noise. Rising shot volume, offensive-zone time and shot quality across five straight games is a trend worth acting on.
Test hypotheses
“They’re bad on the penalty kill” is a hypothesis. Twenty games of data, split by opponent, is the test. Analysis without a test is just an opinion.
Prepare the next game
The last breakdown is the input for the next matchup: what worked, what to repeat, and where the opponent has already figured you out.
Build a knowledge base
Every game becomes a row in a dataset. After a season you have history you can query and model instead of trying to remember “that game back in January”.
The breakdown: from raw footage to conclusions
Order matters. Record the facts first, interpret later — start with the opinion and the facts will bend to fit it.
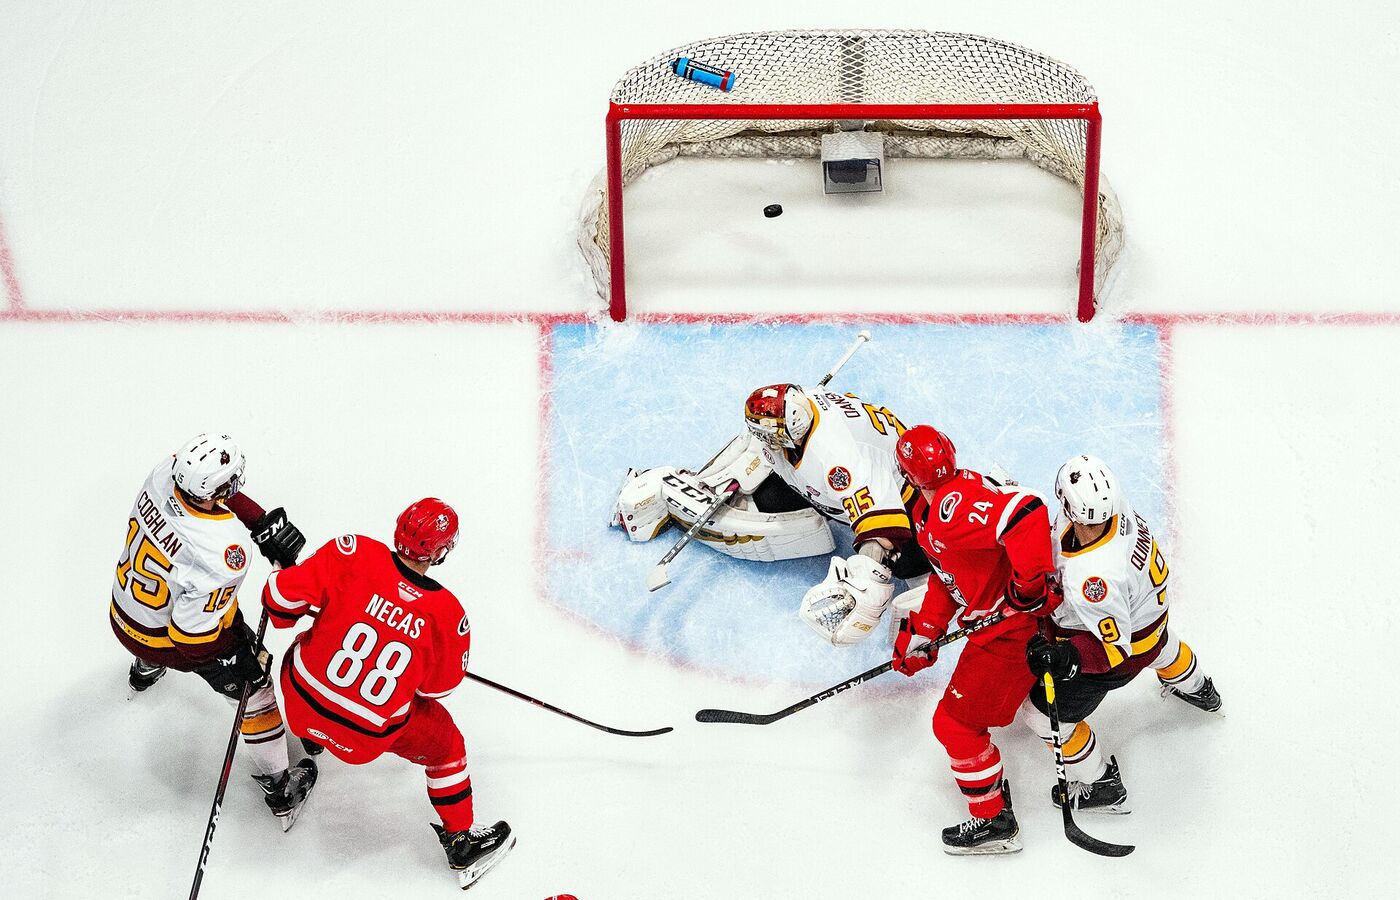
Rule of the breakdown: every conclusion must rest on something verifiable — a number, an episode, or both. “They played worse” is not a conclusion. “They lost 62% of defensive-zone faceoffs and conceded twice off clean zone entries” is. — baseline standard for an analyst
What to collect: the minimum viable stat sheet
You don’t need 300 indicators. Thirty is enough — as long as you collect them the same way, every time.
| Block | Indicators | What it tells you |
|---|---|---|
| Result | goals by period, period scores, final result, overtime / shootout | records what happened, not why |
| Offence | shots, shots on goal, scoring chances, xG, zone entries, giveaways | volume and quality of attacking play |
| Defence | shots against, takeaways, interceptions, blocked shots, defensive-zone errors | goaltender workload and defensive structure |
| Special teams | power play: goals / attempts, conversion; penalty kill: goals against, zone retention | special teams often decide tight games |
| Faceoffs | won / lost, split by zone | possession and how attacks start |
| Discipline | penalty minutes, penalties by type, streaks | direct impact on workload and goals |
| Goaltending | shots against, saves, save %, empty-net situations | separates the goalie’s contribution from the team’s |
| Shifts | shift length, line combinations, defensive pair rotations | which combinations generate an edge |
Key metrics and how to read them
The formulas are simple. The hard part is discipline: measuring the same thing the same way every time.
Corsi (CF%)
Your share of all shot attempts — including blocked and missed shots — out of both teams’ attempts at even strength. CF% = CF / (CF + CA). A blunt but very stable pressure indicator.
Fenwick (FF%)
The same idea without blocked shots. Slightly closer to the shots that actually reach the net and the pressure they create.
Expected goals (xG)
The sum of goal probabilities for each shot, based on location, distance, shot type and situation. It measures the quality of chances, not just their number. xG/60 makes players comparable across different ice time.
PDO
Save percentage plus shooting percentage. It hovers around 100% over time — large short-term swings usually say more about luck than about skill.
Power-play conversion
PP% = power-play goals / power-play opportunities. Read it alongside power-play xG: conversion can be low while the chances are excellent.
Penalty-kill reliability
PK% = 1 − goals allowed / times shorthanded. Also track opponent xG per shorthanded minute — structure matters more than the counting stat.
Tracking teams
A team is a system. Break it down at the level of structure, not just results.
- Playing profile: pace (shots per 60), balance of attacking and defensive actions, favourite zone-entry sides.
- Game states: behaviour when leading, leading late in the third, and trailing by one.
- Special teams: power-play shape (setup, roles, half-wall vs. point play), shorthanded pressure.
- Goaltending load: start distribution, quality of shots against, the goalie’s contribution to results.
- Home vs. road: compare metrics separately — the gap often reflects style, not class.
- Streaks: last 5–10 games against the season average. Three games of falling xG is a signal.
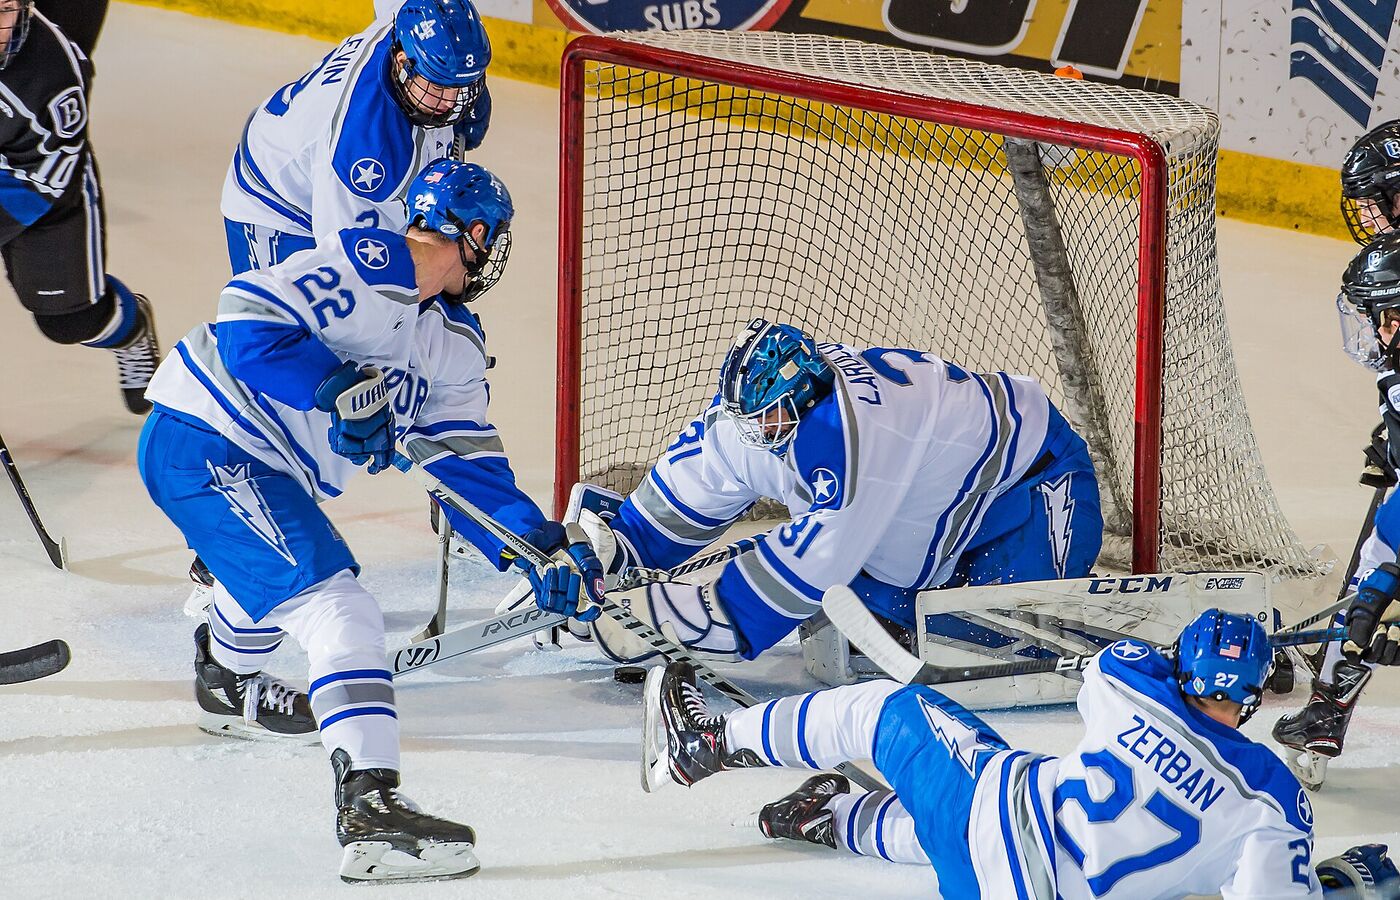
Example: team comparison
| Metric | Home | Away |
|---|---|---|
| CF% (5-on-5) | 54.1% | 48.7% |
| xG per 60 | 2.8 | 2.2 |
| PP% | 23% | 17% |
| PK% | 81% | 76% |
| Shots per 60 | 32 | 29 |
How to read that table
The home team is ahead on pressure and chance quality — but this is a ten-game average, not a promise about one specific night. Compare against opponents of similar quality and look at the trend in recent games. A single table is never enough for a conclusion: you also need schedule context, injuries and freshness.
Tracking players
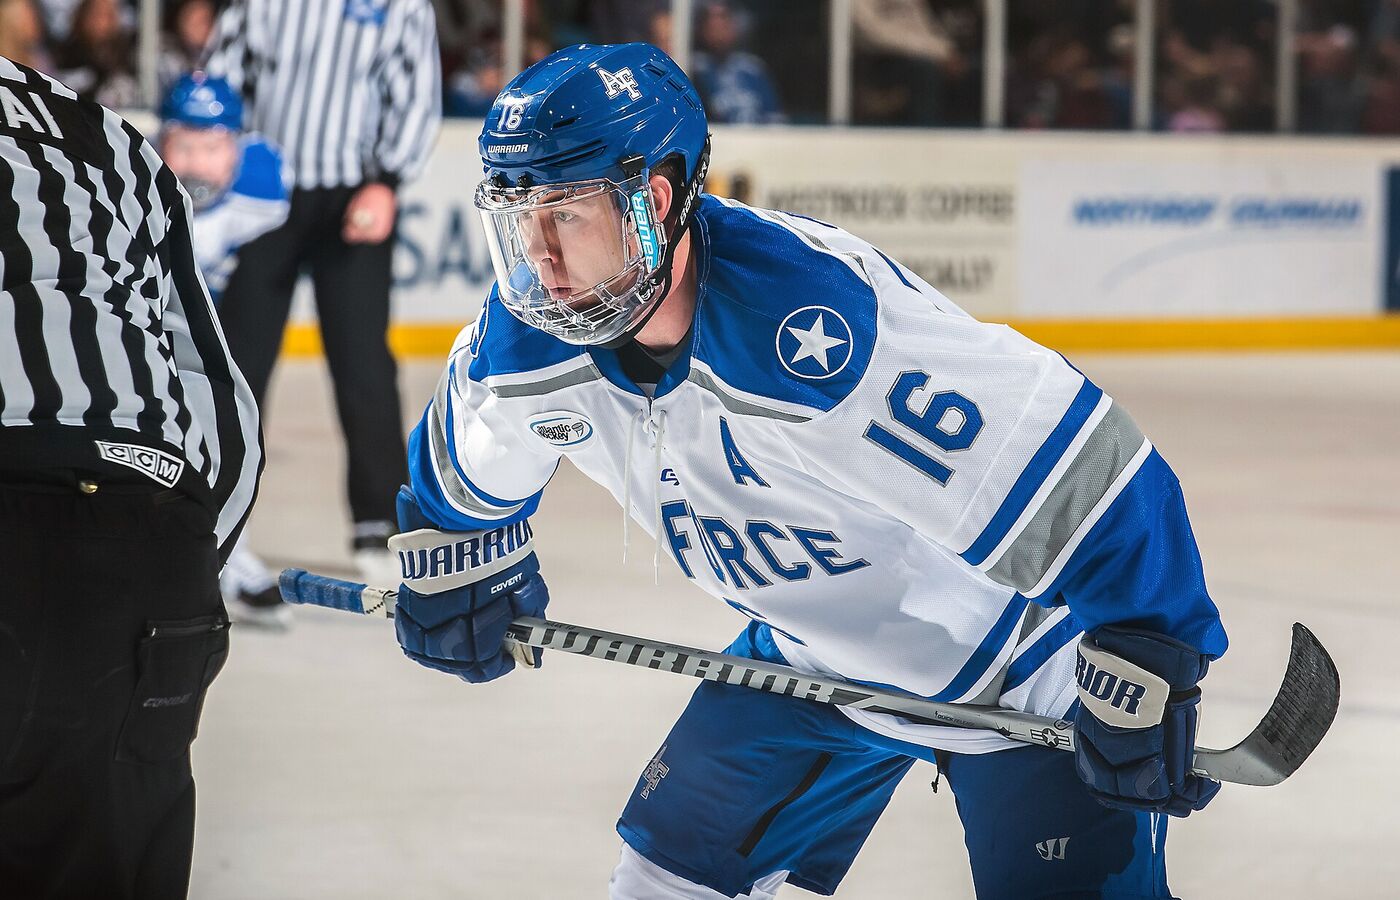
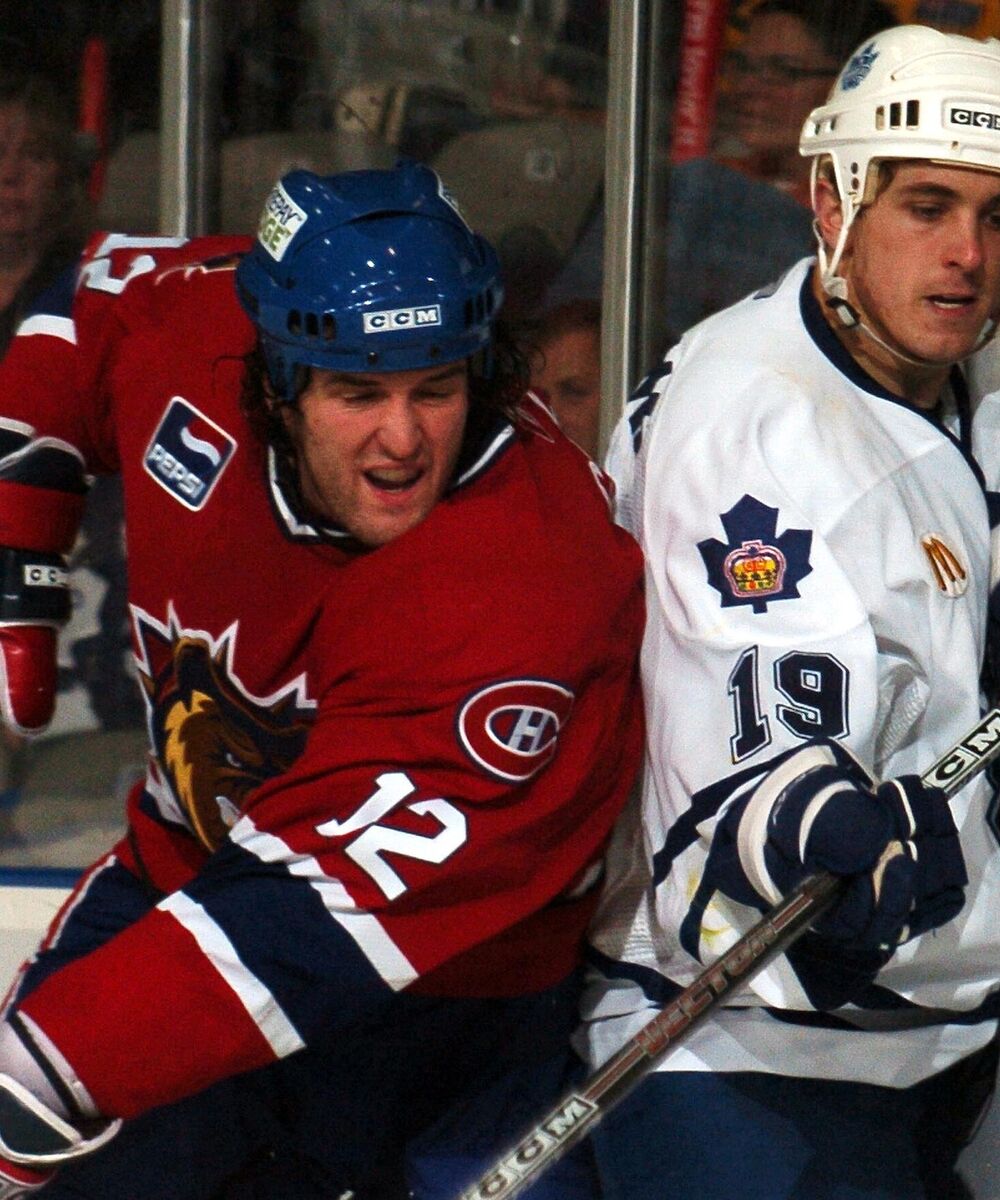
Evaluate impact on play, not just points. Points lean heavily on linemates and power-play time.

Volume & quality
Shots per 60, xG per 60, Corsi shares with specific linemates.
Role
Line, power play and penalty kill usage, shift counts, typical positions on the ice.
Reliability
Minutes against elite lines, defensive-zone errors, discipline.
Trend
Five-game rolling averages: the direction matters more than any single spike.
Chemistry
Which combinations produce the best shot and chance differential — and how they change when linemates change.
Context
Opponent, home or road, rest and travel. The same player in different contexts is a different set of numbers.
Minimum player card
Position, line, ice time, shots per 60, xG per 60, CF% with each linemate, penalty minutes, five-game trend and an analyst note. That is enough for a real conversation about form without getting lost in points.
The data journal
A breakdown you don’t write down is worthless. Anything you don’t record lives for exactly one day.
- One template: one file or table per game with fixed fields — date, teams, score, metrics, conclusions.
- Stable IDs: every game gets a unique identifier so re-tagging never duplicates data.
- Raw data separate from derived data: events are never overwritten by metrics; metrics are recomputed from events.
- Versioning: if you refine the tagging, keep a version — comparing before and after exposes systematic error.
- Review calendar: once a month, revisit team and player trends instead of only looking at the latest game.
A good analytical archive answers this in five minutes: “How has this team played in the third period while trailing by one over its last ten games?” If answering requires digging up recorded footage and recomputing by hand, the database is built wrong.
Common mistakes
Fitting the narrative to the score
When a team wins, people find its “winning style”. Analysis should start from episodes and metrics, not the final result.
Small samples
One game is noise. Conclusions about players or teams need a series of games.
Equating points with performance
Goals depend on linemates and finishing. Look at contribution to pressure and chance quality, not only points.
Incomparable data
Comparing home and road games, different opponents or different ice time without normalising produces false trends.
Ignoring the goaltender
Saves matter. Part of the difference in results is explained by the goalie, not by defensive structure.
Breaking down without a format
If every game is analysed a different way, the data never becomes a database and comparisons become impossible.
Bottom line
Breaking down hockey is a habit: watch the game as a set of verifiable events, compute the same metrics every time, and log the conclusions in a consistent form. A system beats intuition not because it is error-free, but because it lets you find the errors and fix them. Start with one game, one template and five takeaways — and by the end of a season you’ll have a model you can actually trust.